Create your own HighCohesion integrations dashboard in Claude
Use one Claude prompt and the HighCohesion MCP Server to build a dashboard of your streams, failures and open issues, then customise it for your team.
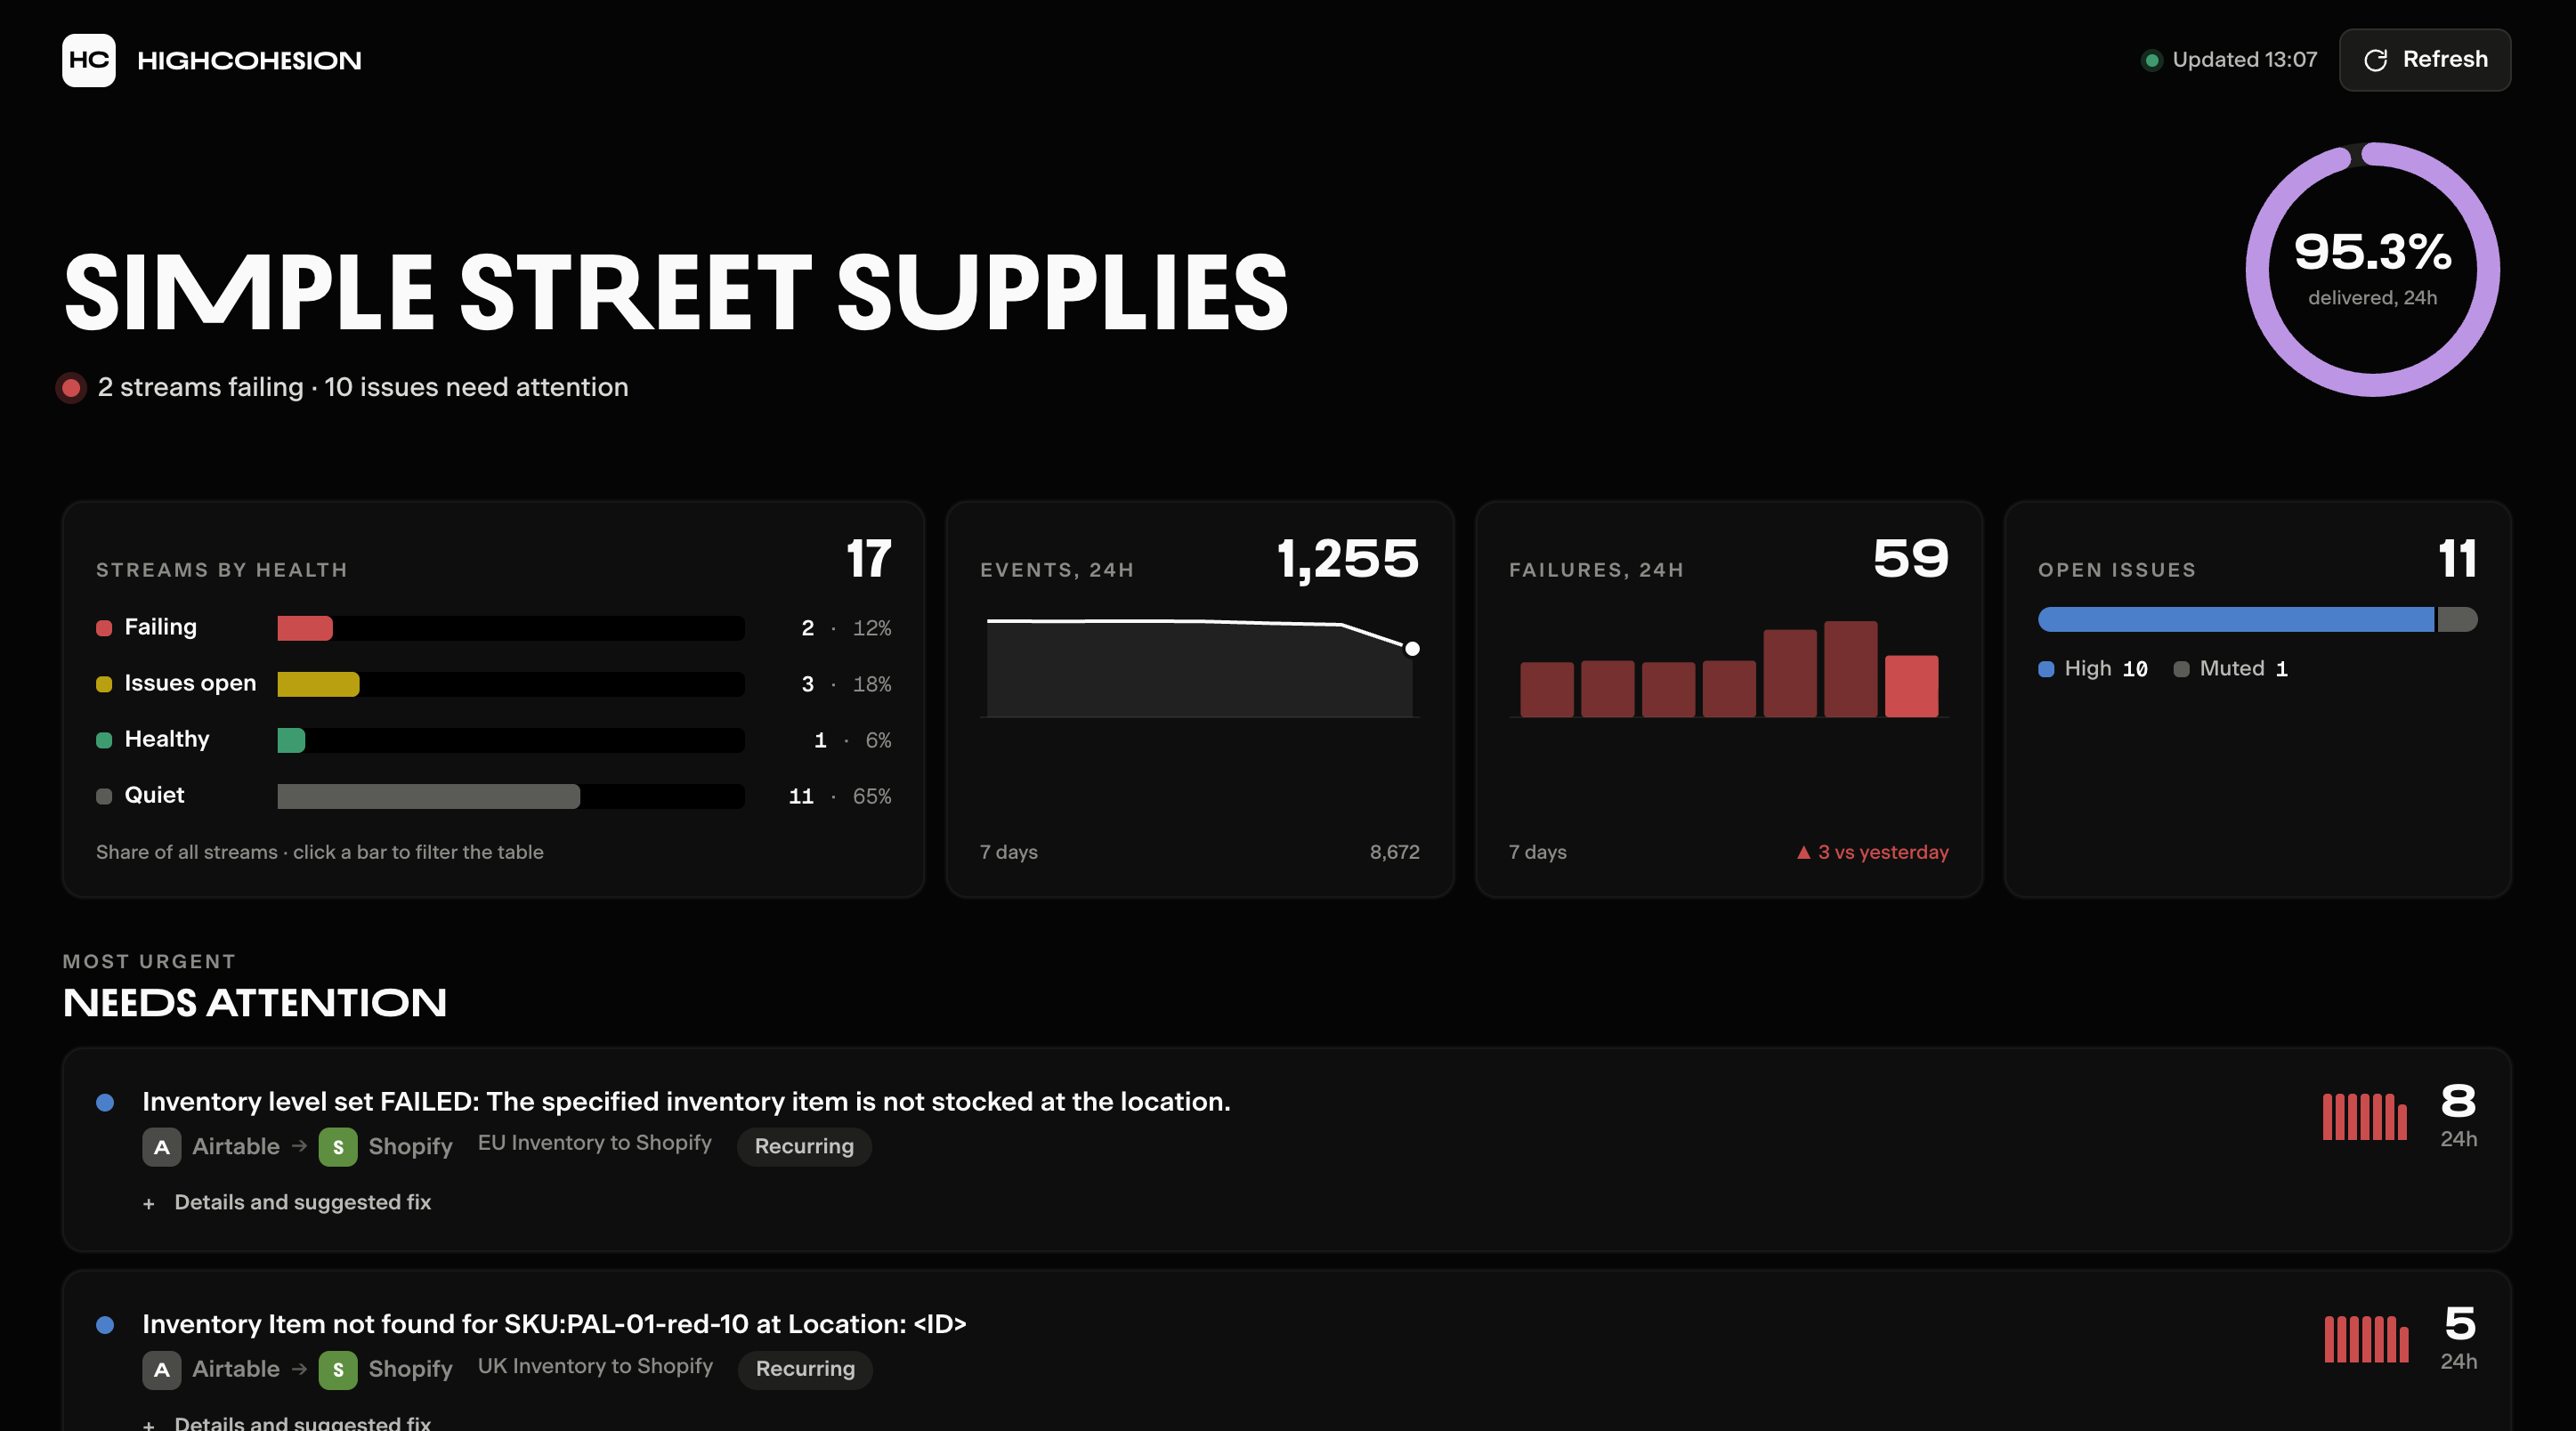
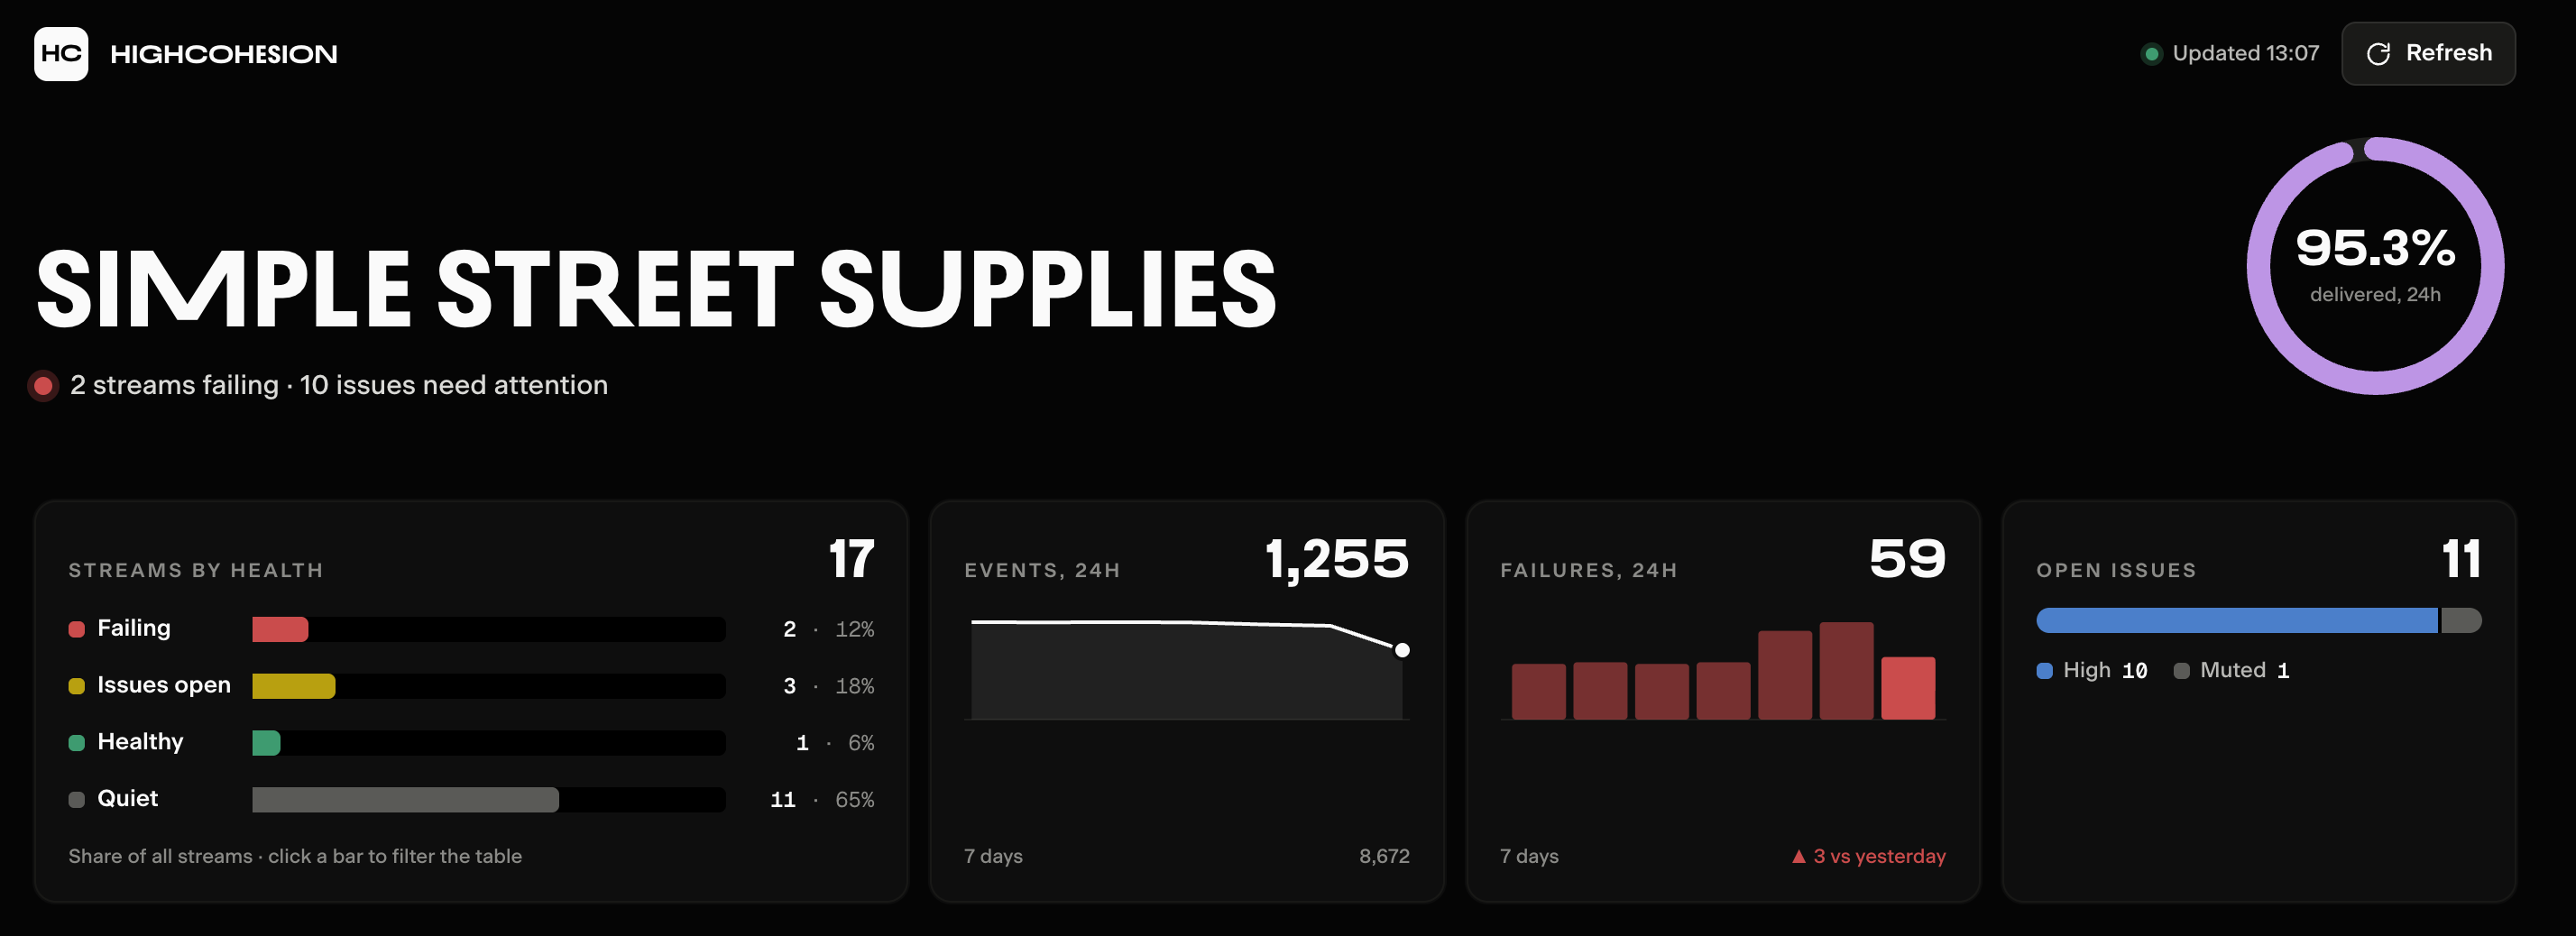
Build a monitoring dashboard for your integrations in Claude, using the HighCohesion MCP Server. You paste one prompt, and Claude builds a page you can reopen and share that shows your streams, failures, open issues and recent changes.
What you get
The dashboard reads your HighCohesion data through the HighCohesion MCP Server (the connector that lets Claude read your account). It shows:
Overall health: the share of events delivered in the last 24 hours, and how many streams are failing. A stream is one configured integration, for example Shopify orders into NetSuite. An event is one record passing through it, for example one order.
At a glance: streams by health, events and failures over 7 days, and open issues by severity. An issue is a group of repeated failures with the same cause.
Needs attention: the five open issues to look at first, with the affected records and the suggested fix.
Streams: every stream, its systems, volumes, failures and open issues, with filters and search.
Work log: what is still open, what changed recently and what has been closed.
The dashboard is read-only, like the MCP Server itself. To fix a failure, use the Control Panel.
Before you start
Claude connected to the HighCohesion MCP Server. If you have not done this yet, follow Connect Claude to HighCohesion MCP Server.
A Claude plan that can create artifacts (pages Claude builds and keeps for you).
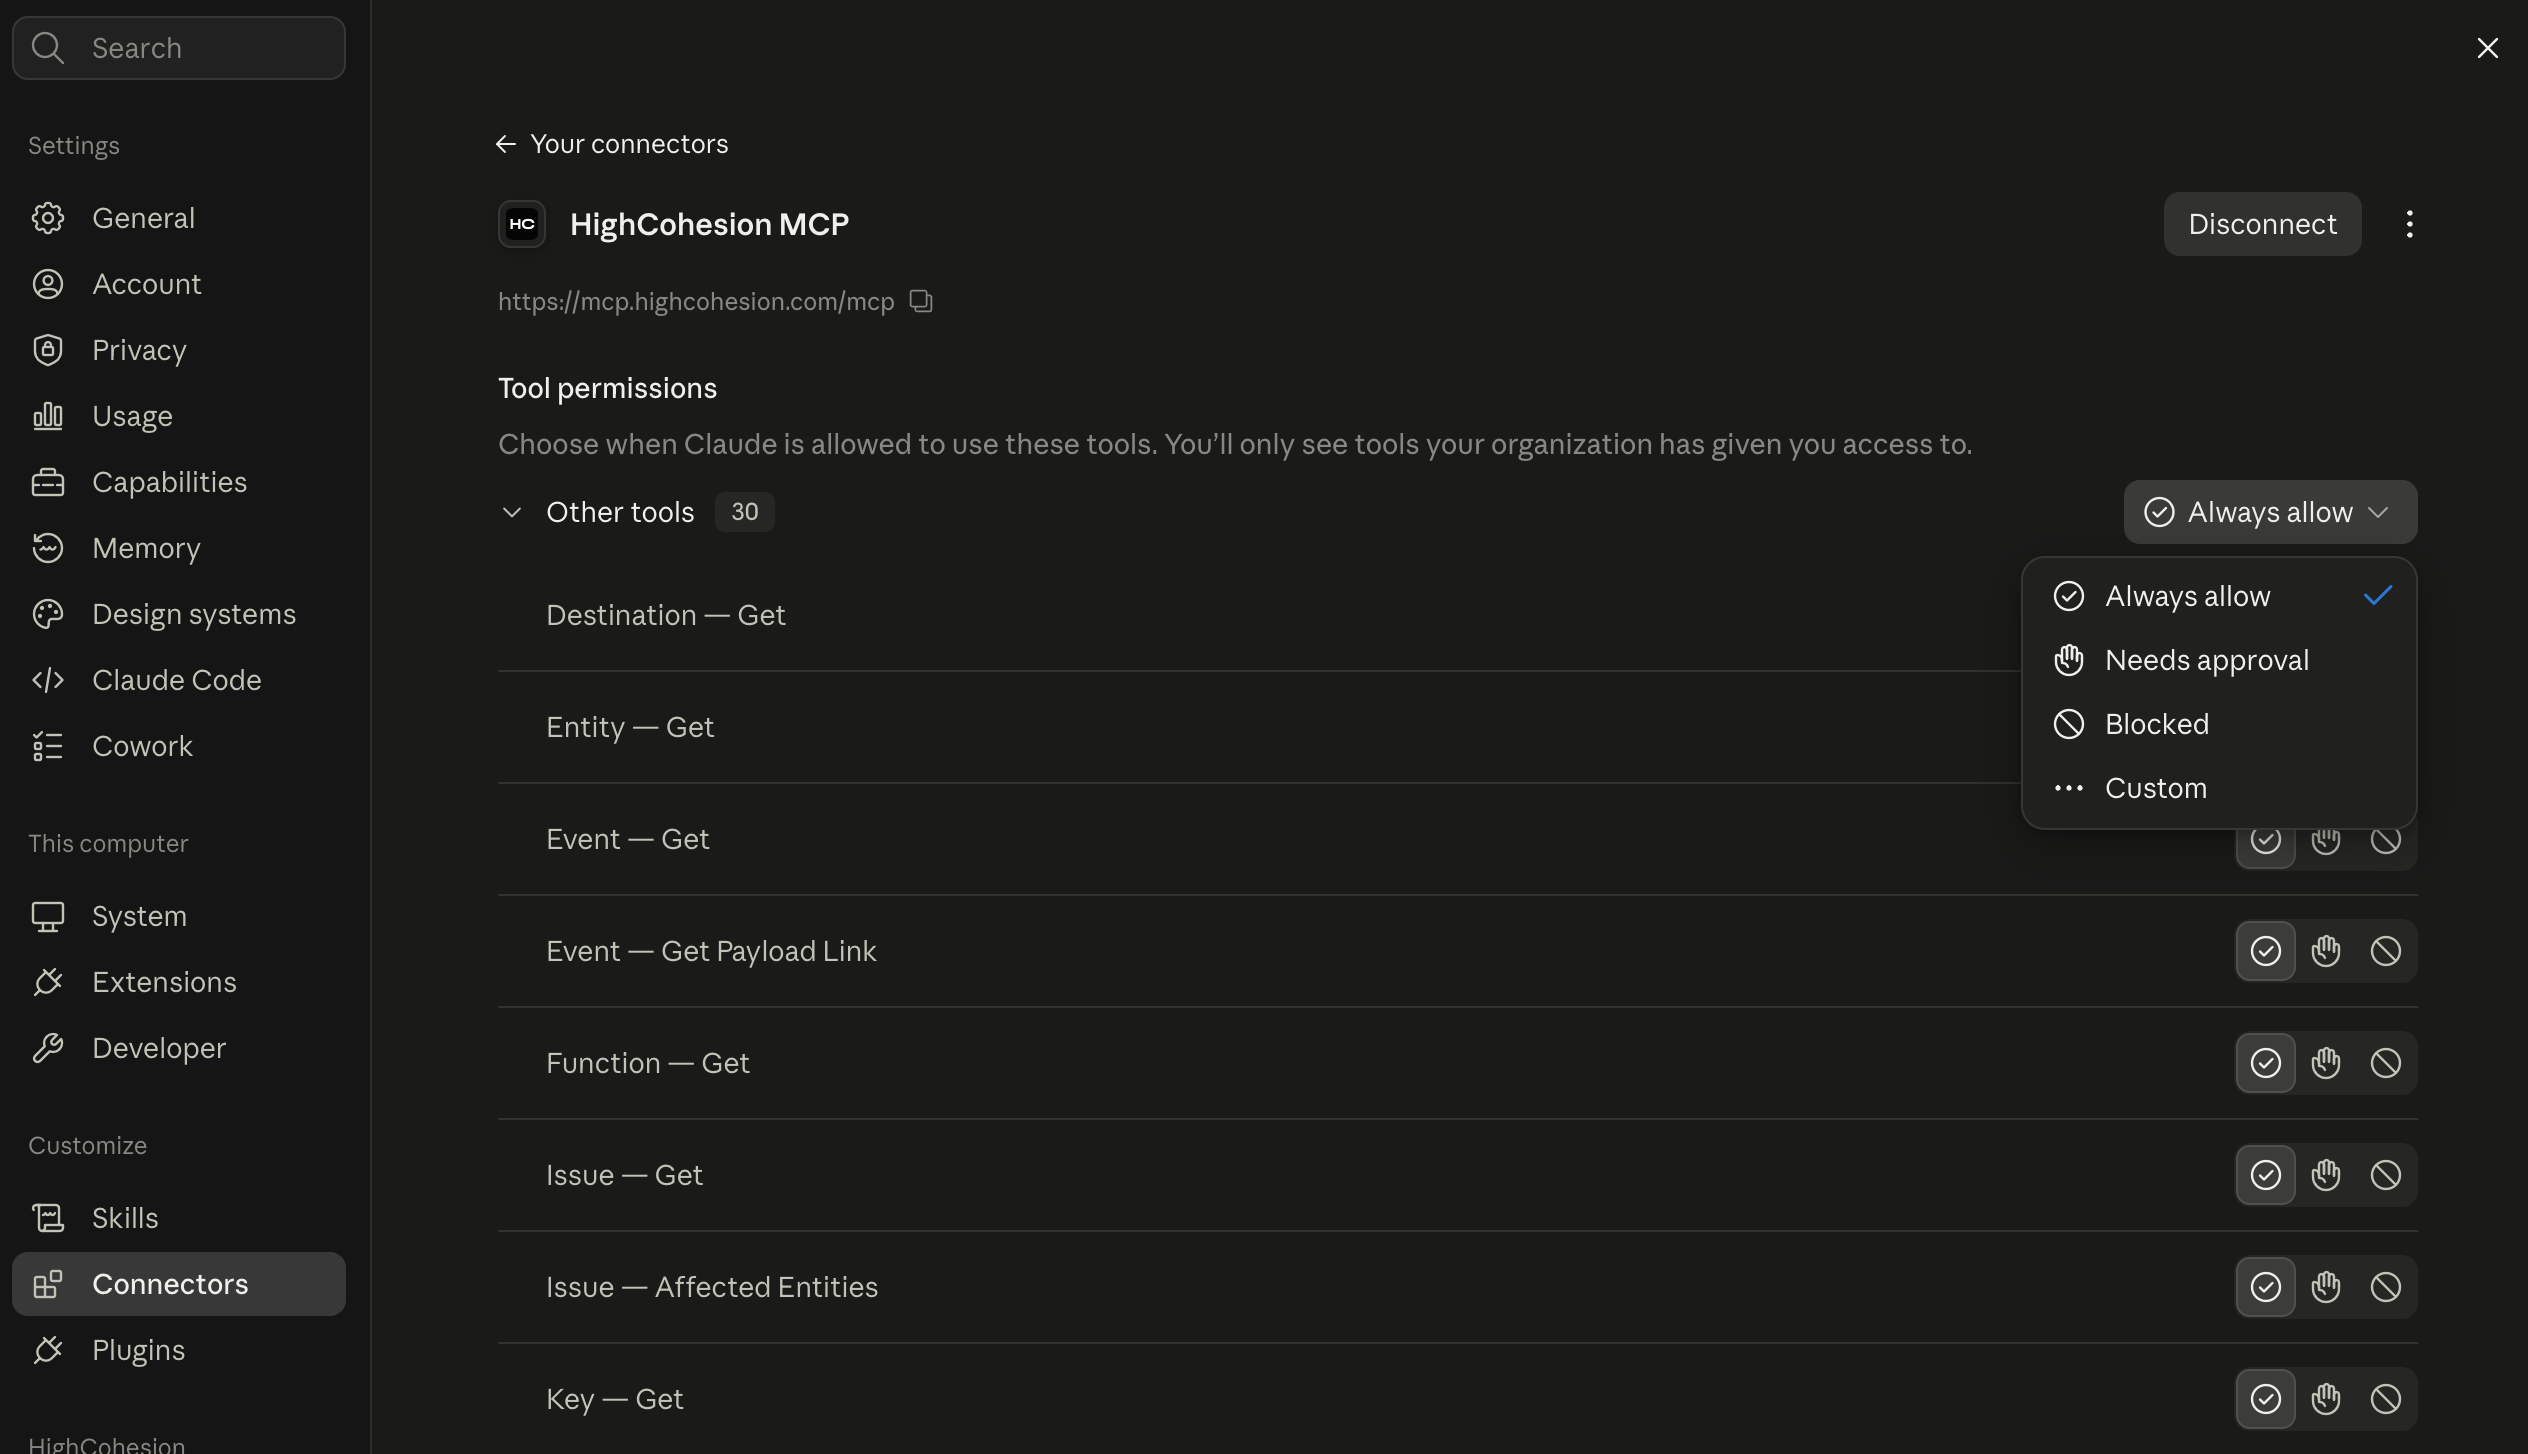
Optional: set the HighCohesion tools to Always allow in the connector's Tools tab under Settings → Connectors. The dashboard calls several tools each time it loads, and this saves you approving each one.
Create the dashboard
Start a new chat in Claude.
Check that HighCohesion is switched on under + → Connectors.
Copy the prompt below and paste it into the chat. Replace the text in [square brackets] first.
Approve the HighCohesion tools when Claude asks.
Open the dashboard from the card Claude shows when it has finished. The first time the page loads, it may ask permission to use the HighCohesion connector. Allow it.
The prompt
Using the HighCohesion connector, build me an integration monitoring dashboard as an artifact I can reopen and share.

Data
- Call whoami first to find my organisation.
- Use the HighCohesion tools: list_streams, list_sources, list_destinations, list_issues, list_occurrences and list_events.
- Make the page load live data from the HighCohesion connector each time it opens, and refresh every 5 minutes while it is open. If the page cannot call the connector itself, build it from the data you read now and show clearly when that data was taken.
- For counts, use include_total with page_size 1 rather than paging through every event.
- Show all times in [your time zone, e.g. UK time].

Sections, in this order
1. Header: [your company name], the share of events delivered in the last 24 hours (1 minus failures divided by events) as a ring chart, and one short sentence on overall status, e.g. "2 streams failing · 5 issues need attention".
2. At a glance, as four cards:
   - Streams by health as a horizontal bar chart (Failing, Issues open, Healthy, Quiet) with counts and percentages. Clicking a bar filters the streams table.
   - Events in the last 24 hours, with a 7-day trend line.
   - Failures in the last 24 hours, with 7-day bars and the change against the previous 24 hours.
   - Open issues, as one bar split by severity, with muted issues shown separately.
3. Needs attention: the top 5 open, unmuted issues, ranked by priority, failures in the last 24 hours and how recently they happened. For each, show the error in plain English, the stream and its source and destination systems, a 7-day failure trend and the 24-hour count. Put the affected records, the suggested fix and the raw error behind a "Details" toggle.
4. Streams table: every stream with its source and destination systems, health, events and failures in the last 24 hours, a 7-day failure sparkline, open issues and last configuration change. Problem streams first. Add filters for live, test mode and "with issues", and a search box. Clicking a row shows the source and destination details and that stream's open issues.
5. Activity: events and failures per day for the last 7 days, as two bar charts.
6. Work log, as three columns:
   - Still to do: open issues, most urgent first, showing the 10 most urgent with a "Show all" button.
   - Recently changed: issues raised, issues closed and stream configuration changes in the last 90 days.
   - Closed: closed issues, flagging any that closed automatically and later came back.

Health rules
- Failing: failures in the last 24 hours are 5% or more of that stream's events, or it has failures and no events.
- Issues open: any failures in the last 24 hours, or an open issue that is not muted.
- Quiet: no events in the last 24 hours.
- Healthy: everything else.

Design
- Keep it graphical and uncluttered: charts and status colours first, text second.
- Red for failing, yellow for issues, green for healthy, grey for quiet. Always show a label next to a colour.
- It must work at phone width and in light and dark mode.
- If a section fails to load, show what went wrong in that section and keep the rest of the page working.
Customise your dashboard
Change the prompt before you send it, or ask Claude for changes once the dashboard exists. Claude updates the same page, so the link stays the same.
Common changes
When you change brand colours, keep red, yellow and green for health so the status stays easy to read.
Large accounts
The dashboard asks for each stream's event count separately, so with 100 or more streams the event figures fill in after the rest of the page. To keep it quick, ask Claude to "show the 20 streams with the most problems, with a button to show the rest", or build separate dashboards for different groups of streams.
What you should see
A page headed with your company name and a ring chart showing the delivery rate, followed by charts, the issues that need attention, your streams table and the work log. Stream names, issues and errors match what you see in the Control Panel. The top right of the page shows when the data was last updated.
Sharing the dashboard
You can share the dashboard from Claude's share menu. Each person who opens a live dashboard sees data through their own HighCohesion connection. They need their own Control Panel login and Claude connected to the HighCohesion MCP Server, and they only see your organisation's data if their login allows it.
Warning: a snapshot dashboard (one built from data Claude read in the chat) contains your data inside the page, including customer details such as order numbers. Only share it with people who are allowed to see that data.
If it did not work
The page shows no data. Check that HighCohesion is switched on for the chat, that you allowed the connector when the page asked, and that the HighCohesion tools are approved. If your connection has lapsed, reconnect HighCohesion under Settings → Connectors.
The page shows data from when it was built, not live data. Your Claude plan may not let artifacts call connectors. Ask Claude to "rebuild the dashboard with today's data" whenever you need fresh figures.
The numbers differ slightly from the Control Panel. Check the time window and time zone. The delivery rate is an estimate, because one event can fail more than once. Events older than HighCohesion's retention period are not counted.
A section shows an error. Click Refresh. If the error stays, send the message to support@highcohesion.com.
Related
Was this helpful?
Still need help? Ask the team